02. Preparing predictor variable fields#
In this tutorial, we’ll cover the preparation of the distance to the coastline field using the parameters from another typical predictor variable for air temperatures, altitude. The altitude predictor variable is obtained using a Digital Elevation Model (DEM).
In PyMica, predictor variable fields used for interpolation must have the same extension, spatial resolution, and projection. Therefore, the DEM will be used as a reference to build the others.
Distance to Coastline#
PyMica provides a utility to build a distance to the coastline field using a DEM and a coastline GeoJSON file. Let’s now import the necessary modules.
from osgeo import gdal

from pymica.utils.distance_to_coastline import get_dist_array
For the get_dist_array function, we need four parameters:
projection, geotransform, size, and a coastline file. We’ll obtain the
first three from the DEM, and the coastline file will be sourced from
the explanatory folder.
dem_file = 'sample-data/explanatory/cat_dem_25831.tif'
dem = gdal.Open(dem_file)

projection = 25831
geotransform = dem.GetGeoTransform()
size = [dem.RasterXSize, dem.RasterYSize]
coast_line = 'sample-data/explanatory/cat_coast_line.json'
Now, let’s check the values of each parameter.
print('Geotransform: ', geotransform)
print('Size        : ', size)
Geotransform:  (260000.0, 270.0, 0.0, 4750000.0, 0.0, -270.0)
Size        :  [1000, 970]
Once all the parameters are set, we can call the get_dist_array
function. First we’ll import it from
pymica.utils.distance_to_coastline and then apply it the previously
defined parameters.
dcoast_field = get_dist_array(proj=projection, geotransform=geotransform, size=size, dist_file=coast_line)
Progress: 100%
Now, we can get a quick look of the dcoast_field array using
matplotlib.
import matplotlib.pyplot as plt

plt.imshow(dcoast_field)
plt.colorbar()
plt.show()
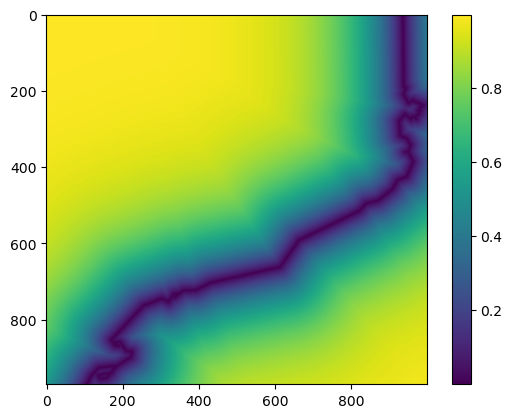
The coastline of Catalonia can be clearly identified. Values close to it are low and exponentially grow as the distance increases from the coast.
Given that the distance to the coastline may be used as a predictor variable, it would be interesting to save it in a raster file for future use in multiple linear regression interpolations.
Then, let’s use the pymica.utils.geotools.save_array_as_geotiff() to
save the dcoast_field into a GeoTIFF file.
from pymica.utils.geotools import save_array_as_geotiff

save_array_as_geotiff("sample-data/results/dcoast_example.tif", dcoast_field, geotransform, projection)
We have now completed this tutorial on how to prepare predictor variable fields to use in the PyMICA class.